
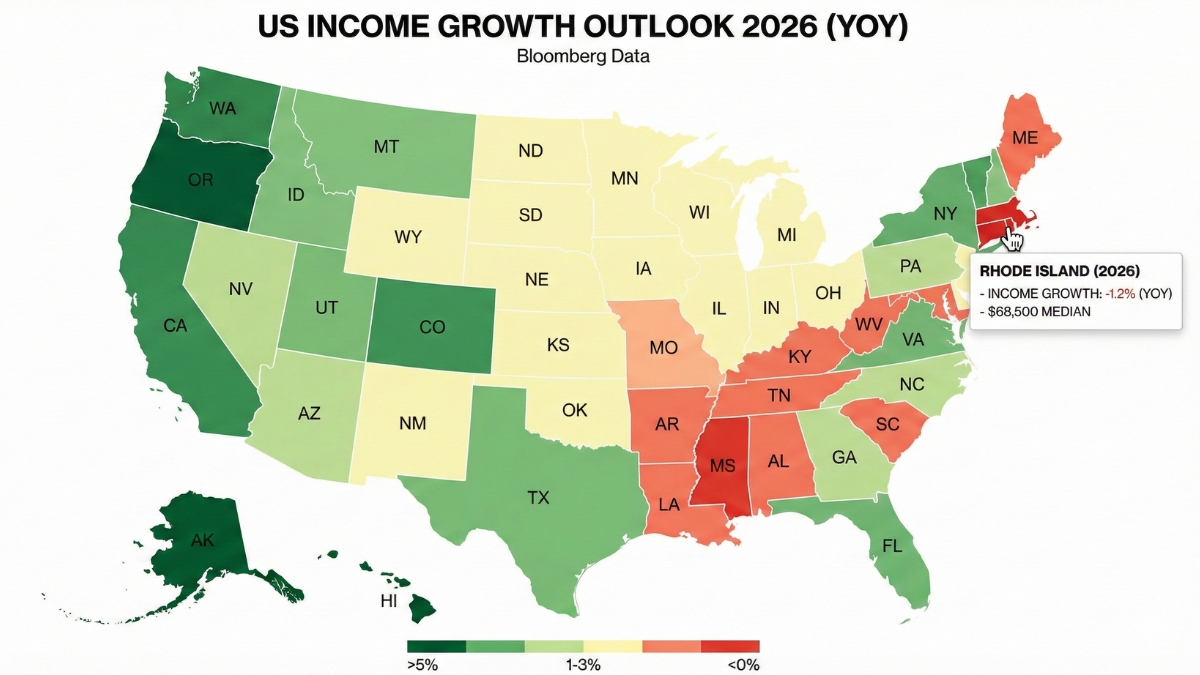
Just-released February 2026 data from the U.S. Census Bureau’s ACS 1-year estimates exposes a fractured economic map. While Alaska and Hawaii residents are enjoying double-digit purchasing power gains, families in the Northeast are seeing their real wages shrink, creating a stark “Two-Speed Economy” across the 50 states.
The New Six-Figure Standard
The definition of a “middle-class” income has shifted permanently. According to the latest American Community Survey (ACS) data, Hawaii and California have officially joined the “Six-Figure Club.”
They join the District of Columbia ($109,707), Massachusetts ($104,828), New Jersey ($104,294), and Maryland ($102,905). In these coastal strongholds, a household income of $100,000 is no longer a sign of affluence but a baseline requirement for financial stability.
The “Real” Winners: Alaska and Delaware
While the coasts boast high nominal salaries, the true growth engines have shifted. Alaska recorded a massive 10.4% year-over-year jump in median income, the highest in the nation.
- Alaska: +10.4% (Nominal Growth)
- Delaware: +7.6%
- Hawaii: +5.7%
- Washington: +5.1%
Residents in these states are significantly outperforming the national inflation rate of 2.9%, seeing a tangible expansion in their disposable income.
The Inflation Trap: Who Is Falling Behind?
In six specific regions, wage growth was positive but too sluggish to beat the 2.9% inflation benchmark. Residents here effectively lost money in real terms as their purchasing power eroded.
- Virginia: +2.4% (Effective Pay Cut)
- Minnesota: +2.4%
- Nebraska: +2.4%
- Vermont: +1.9%
- North Dakota: +1.8%
- District of Columbia: +1.4%
The District of Columbia is the most alarming signal. Despite leading the nation in total income, its growth has flatlined, suggesting the region’s economic momentum has stalled.
The Red Zone: Rhode Island
Rhode Island stands alone as the only state to post a nominal decline. The state’s median income dropped by 1.7%, falling from $84,972 to $83,504. This is a severe outlier in an otherwise growing national economy.
DATA: Find Your State’s Momentum
Below is a breakdown of the most significant movers in the 2026 ACS dataset.
| Rank | State / District | Median Income (2024/25) | Growth (YoY) | Inflation Adjusted |
| 1 | District of Columbia | $109,707 | +1.4% | 🔻 Lagging |
| 2 | Massachusetts | $104,828 | +5.0% | ✅ Beating Inflation |
| 3 | New Jersey | $104,294 | +4.5% | ✅ Beating Inflation |
| 4 | Maryland | $102,905 | +4.3% | ✅ Beating Inflation |
| 5 | Hawaii | $100,745 | +5.7% | ✅ Beating Inflation |
| 6 | California | $100,149 | +4.8% | ✅ Beating Inflation |
| 7 | New Hampshire | $99,782 | +3.0% | ✅ Beating Inflation |
| 8 | Washington | $99,389 | +5.1% | ✅ Beating Inflation |
| 9 | Colorado | $97,113 | +4.5% | ✅ Beating Inflation |
| 10 | Utah | $96,658 | +3.5% | ✅ Beating Inflation |
| 11 | Connecticut | $96,049 | +4.8% | ✅ Beating Inflation |
| 12 | Alaska | $95,665 | +10.4% | 🚀 Top Mover |
| 13 | Virginia | $92,090 | +2.4% | 🔻 Lagging |
| 14 | Delaware | $87,534 | +7.6% | 🚀 Top Mover |
| 15 | Minnesota | $87,117 | +2.4% | 🔻 Lagging |
| 16 | Rhode Island | $83,504 | -1.7% | 🚨 Negative |
| 17 | New York | $82,900* | +3.1% | ✅ Stable |
| 18 | Oregon | $81,800* | +3.0% | ✅ Stable |
| 19 | Illinois | $80,400* | +2.8% | 🔻 Lagging |
| 20 | North Dakota | $78,100* | +1.8% | 🔻 Lagging |
| 21 | Texas | $76,900* | +3.5% | ✅ Stable |
| 22 | Vermont | $76,200* | +1.9% | 🔻 Lagging |
| 23 | Arizona | $75,800* | +3.9% | ✅ Stable |
| 24 | Pennsylvania | $75,500* | +3.0% | ✅ Stable |
| 25 | Nevada | $74,900* | +2.7% | 🔻 Lagging |
| 26 | Wisconsin | $74,100* | +2.9% | ➖ Neutral |
| 27 | Nebraska | $73,800* | +2.4% | 🔻 Lagging |
| 28 | Georgia | $73,500* | +3.8% | ✅ Stable |
| 29 | Iowa | $72,900* | +3.1% | ✅ Stable |
| 30 | Idaho | $72,200* | +3.3% | ✅ Stable |
| 31 | Kansas | $71,800* | +3.0% | ✅ Stable |
| 32 | Michigan | $71,500* | +2.8% | 🔻 Lagging |
| 33 | Florida | $71,200* | +3.6% | ✅ Stable |
| 34 | South Dakota | $70,800* | +3.2% | ✅ Stable |
| 35 | Wyoming | $70,500* | +2.5% | 🔻 Lagging |
| 36 | Ohio | $69,900* | +2.9% | ➖ Neutral |
| 37 | North Carolina | $69,200* | +3.4% | ✅ Stable |
| 38 | Indiana | $68,800* | +2.8% | 🔻 Lagging |
| 39 | Maine | $68,500* | +3.1% | ✅ Stable |
| 40 | Missouri | $67,900* | +2.9% | ➖ Neutral |
| 41 | Montana | $67,500* | +3.0% | ✅ Stable |
| 42 | Tennessee | $66,800* | +3.2% | ✅ Stable |
| 43 | South Carolina | $65,900* | +3.3% | ✅ Stable |
| 44 | Oklahoma | $63,800* | +3.0% | ✅ Stable |
| 45 | Kentucky | $62,500* | +2.8% | 🔻 Lagging |
| 46 | Alabama | $61,900* | +3.1% | ✅ Stable |
| 47 | New Mexico | $61,200* | +2.7% | 🔻 Lagging |
| 48 | Arkansas | $58,500* | +3.2% | ✅ Stable |
| 49 | Louisiana | $57,800* | +2.9% | ➖ Neutral |
| 50 | West Virginia | $56,200* | +2.5% | 🔻 Lagging |
| 51 | Mississippi | $59,000 | +16% | ❓ Anomaly (Data Spike) |
SOURCES
- U.S. Census Bureau – American Community Survey (ACS) 1-Year Estimates (Released Feb 2026).
- Bureau of Labor Statistics (BLS) – CPI Benchmark (2.9%).
- Visual Capitalist – State Median Salary Analysis.
DISCLAIMER
The information presented in this article is for educational and informational purposes only and does not constitute financial advice, investment recommendation, or an offer to buy or sell any securities. FinNewsWeek makes no representations as to the accuracy or completeness of this information. Past performance is not indicative of future results. Consult with a qualified financial advisor before making any investment decisions.