

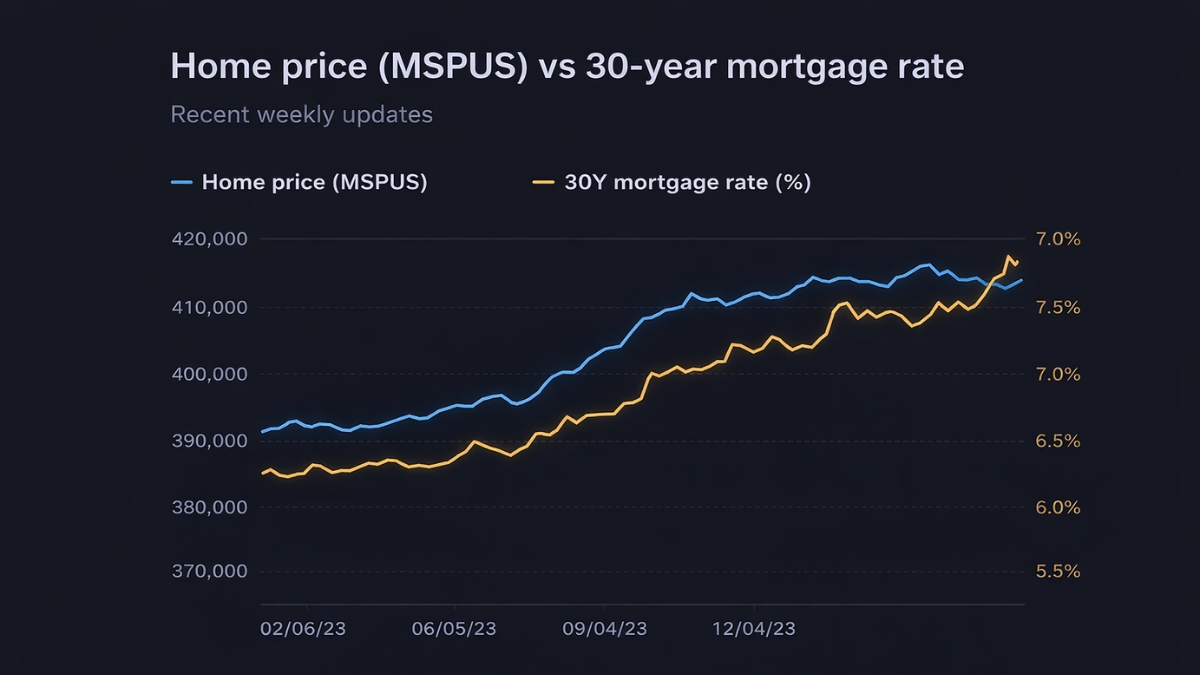
In latest readings (Q2 2025 home-price data; weekly mortgage updates into February 2026), U.S. affordability remains tight. According to FRED’s MSPUS series, the median sales price for new homes sold was $410,800 in Q2 2025. Freddie Mac’s weekly survey has shown 30-year mortgage rates around 6% in recent weeks. That combination keeps monthly payments high even when wages are higher than past generations. Planned budgets also face taxes, insurance, repairs, and existing debt burdens.
Key numbers
- $410,800: U.S. median new-home sales price (Q2 2025, FRED MSPUS)
- ~6%: 30-year fixed mortgage range in recent weekly Freddie Mac updates
- $80,000: 20% down payment on a $400,000 home
- ~$670/month: payment gap between 3.0% vs 6.5% on a $320,000 loan
- 6.5 million: job openings in latest JOLTS context (labor backdrop)
The “Higher Salary” Illusion: Why We Look Richer on Paper but Feel Poorer in Reality
Nominal pay is higher than decades ago. But affordability is a payment problem, not a headline-income problem.
According to federal housing and rate data, today’s buyer often faces:
- a higher price base,
- a higher financing cost than in 2020–2021,
- a larger cash hurdle for down payment and closing,
- and larger non-mortgage ownership costs in many markets.
So households can look better on paper and still feel stretched in real monthly cash flow.
Then vs. Now: How the U.S. Housing Affordability Formula Changed
The formula is simple:
Monthly housing cost ÷ take-home income = affordability pressure.
What changed is each input.
According to FRED MSPUS, the median new-home price in Q2 2025 was $410,800.
According to Freddie Mac weekly mortgage updates, 30-year rates have stayed near 6% in recent readings into February 2026.
A buyer at a higher salary still loses affordability when both price and borrowing cost rise together.
The Rate Shock: How 6%+ Mortgages Wipe Out Income Gains
A rate move can erase wage gains fast.
On a $320,000 loan (example only):
- At 3.0%, principal and interest is about $1,350/month.
- At 6.5%, principal and interest is about $2,020/month.
That is roughly $670 more per month, before taxes, insurance, HOA, and repairs.
According to Freddie Mac’s rate trend, this is why affordability remains tight even when income is higher than before.
The Down Payment Wall: How Many Years It Takes to Save
The down payment is the first gate for many households.
If the target home is about $400,000:
- 20% down = $80,000
- 10% down = $40,000
- 5% down = $20,000
At $1,000 saved per month:
- $80,000 takes about 6.7 years
- $40,000 takes about 3.3 years
- $20,000 takes about 1.7 years
If prices rise during that period, the target can move away faster than savings.
The Hidden Cost of Ownership: Taxes, Insurance, Repairs, and HOA Fees
Mortgage calculators often show only principal and interest. Real ownership cost is broader:
- property taxes,
- homeowners insurance,
- maintenance reserve,
- HOA dues where relevant,
- utility cost shifts after moving from rental housing.
In some regions, insurance and tax changes can add hundreds per month.
This is why two homes with similar list prices can have very different true monthly costs.
Why Our Parents Had an Easier Start: Market Conditions, Demographics, and Rules of the Game
Many prior buyers entered under a different setup:
- lower price-to-income ratios in many metros,
- lower student-debt load for many first-time buyers,
- less concentrated investor competition in some periods,
- and a different supply environment.
This is not a claim that every prior generation had it easy.
It means today’s entry math is tougher in many places.
The Regional Trap: Where Homeownership Is Nearly Out of Reach Even on a “Good” Salary
Affordability is local.
A salary that works in one metro may fail in another once taxes, insurance, and commute trade-offs are included.
In high-cost metros, median listings can exceed practical debt-to-income limits even for solid earners.
In lower-cost metros, ownership may still be possible, but often with trade-offs in size, age, or location.
Rent vs. Buy in 2026: When Waiting Is Smart — and When It Isn’t
Waiting can be rational when:
- job location may change,
- debt payoff can improve DTI within 6–18 months,
- cash reserves are thin,
- local price-to-rent ratios look stretched.
Buying can be rational when:
- full monthly ownership cost is stable,
- household plans to stay long enough to absorb transaction costs,
- reserve cash exists for repairs and shocks.
The key is cash-flow durability, not timing headlines.
What Actually Works: 7 Strategies That Improve Your Home-Buying Odds
- Underwrite full monthly cost (not just mortgage P&I).
- Lower high-interest debt before applying.
- Compare first-time buyer assistance programs by state/city.
- Shop by total monthly cost, not list price alone.
- Expand search radius and property type.
- Keep a separate repair reserve after closing.
- Rate-shop across lenders and compare APR + total fees.
Bottom line in current data
The core issue is structural: home prices, financing costs, and ownership overhead rose faster than affordability comfort for many households. According to current FRED and Freddie Mac readings, higher salaries alone do not restore buying power. Practical progress comes from full-cost planning, debt cleanup, assistance programs, and flexible market selection.
SOURCES
- https://fred.stlouisfed.org/series/MSPUS
- https://fred.stlouisfed.org/series/MORTGAGE30US
- https://www.freddiemac.com/pmms
- https://www.census.gov/construction/nrs/current/index.html
- https://www.bls.gov/news.release/jolts.htm
DISCLAIMER
This content is for informational purposes only and is not tax, legal, or investment advice. Consult a qualified professional for advice specific to your situation.